Timeline in SVGs
I wrote a year ago an XSLT style sheet that can be handy in creating graphical timelines: it takes a simple XML file describing the said timeline, and turns it into an SVG image.
The XML file should look like:
<timeline>
  <start>2009-01-01</start>
  <end>2009-12-31</end>
  <line>
   <bar><start>2009-01</start><end>2009-05</end><name>Task A.1</name></bar>
   <bar><start>2009-07</start><end>2009-10</end><name>Task A.2</name></bar>

  </line>
  <line>
   <bar><start>2009-01</start><end>2009-08</end><name>Task B</name></bar>
  </line>

</timeline>
And turns it into an SVG timeline that looks like:
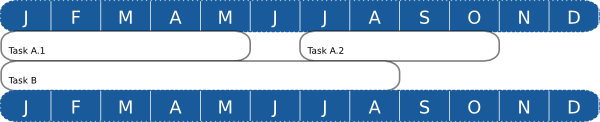
It could use some graphical enhancements, a better SVG markup, and many other improvements, but since I already had a couple of occasions to use it for my own purposes, I’m assuming it might serve as useful inspiration for others who would need something similar.
December 30th, 2010 at 06:16
Do you know if there are more examples available on a W3 page of this XSLT style sheet timeline?
I wonder what others have done with it.
Looking forward to a reply, can be also by email.
Dennis
January 4th, 2011 at 12:15
@Dennis, I’ve used it to generate the diagram of technologies used in the Web compatibility test, for example : http://www.w3.org/2008/06/mobile-test/doc.html
I’ve used it also for presentations that are not public.